Sunday, November 6, 2016

SLV - SILVER ETF

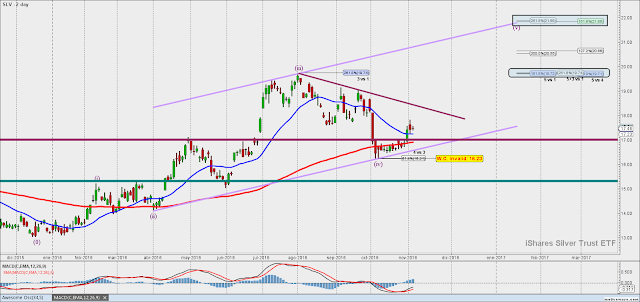
I´m really bullish in Gold and Silver....... and the top form during the year it´s just a pause in the bullish move.

Two different charts and techniques and they show the same scenario in my opinion,


In both cases the charts show an uptrend while the 16.23$ it´s the support.

There are two possible resistence level, one its obvious its the previous high in 19.72$ and the next around the 22$ - 23$ levels.

Time will tell, but when the price moves above the short term downtrend line, it will be the time to buy looking for the upper level of resistence, above 22$ for the next months,

Good Luck and Stops always in the markets


Friday, April 22, 2016

Understanding Market Structure


In my opinion we are un an 3.3 Stage ....... or early 4.1, time will tell, but tha markets are quite vulnerable and the next BIG MOVE will be SOUTH.

Take care and if yoy can´t follow the market it´s time too be OUT of the market or Buy protective assets as SILVER or GOLD.


Thursday, March 31, 2016

If you think its a good time to go LONG, study this chart - DOW JONES

Some times it´s so easy to know when to be Bullish or when to be Bearish, that also gets really scary.... and you have to doubt about all know.


You can see the Negative Divergences in the RSI and how Earnings are going low, so you have to realize it´s not a good moment to Open Long positions. Even if you see the moving Averages 50 and 100 are close to cross each other, its another reference, that makes you be cautious.

So ........ it was a really Big Bull Market, but every market need gas and its running out of gas, maybe has run much longer than expected thanks to the Central Banks, but the Bubble its going to explode in the next months or YEARS ........... but it will.

The markets, the global economy and the World will have a really bad time in the next 4 - 7 Years.so just be careful outside, and just believe in yourself and not in any others people words.


Saturday, February 6, 2016

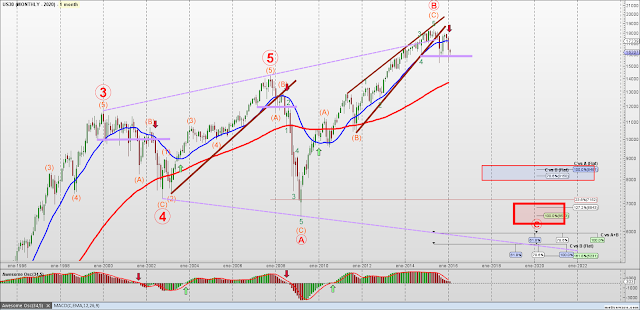
THE BULL MARKET HAVE ENDED


After nearly 2 years i´m gone resume the analysis made in this post: http://ifibo.blogspot.com.es/2014/04/dow-jones-for-next-decade.html

I have little to add to the next chart, everyone should know in which moment of the market we are and it´s pretty obvious that the BULL MARKET have ENDED or its very near to it´s end.

Next Big move will be LOWER AND LOWER and maybe even to the 7.000 points by the year 2019 or 2020.

So taking that in mind, be clever and dont´try to get the lows. In every market there will be ups and downs, and there will be bull stocks, but those will be much more difficult to catch, because most stocks will go down and some could even dissapear.


I have put several rectangules marking the important turning points or big supports, the first one could go around 8500 - 8000 points, the next its the one i think it´s much more important around 6800 - 6500 area.

Althoug it can even go lower .......... but those are the levels to be thinking of turning bullish again, until then, get your money out of stock, and relax with liquidity in your pocket.

No one knows the future, but with the learning of the past, we can try to anticipate what can the future do, and with Green and Red Arrow i have mark the turning point since 2002.

Good Luck and Stops always in the markets.


Elliott_Trader: The Eight-Fold Path

Elliott_Trader: The Eight-Fold Path: A much wiser man than I called the "The Eight Fold Path" the way to enlightenment, and it is in that spirit of sharing that this p...


Just an easy post to understand much better ELLIOTT Trading.


Thanks http://www.studyofcycles.blogspot.com.es/ for so good work